Cavity Ring Down Spectroscopy (CRDS)
CRDS is a sensitive and absolute technique based on absorption spectroscopy. CRDS is frequently applied to the measurement of a variety of atmospheric species from short-lived radicals to VOCs and aerosols both in the lab and the field. We illustrate the application of CRDS in HIRAC with an instrument that has been set up to measure NO3 radicals using visible laser radiation. More recently, we have used NIR radiation to determine HO2 and CH3O2 using CRDS (see instrument development).
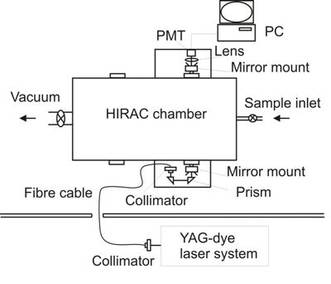
A schematic of the NO3 CRDS setup in HIRAC.
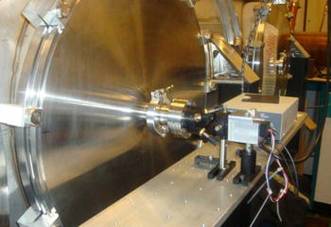
Picture of the NO3 CRDS setup.
How does CRDS work?
CRDS measures the signal intensity decay rate of light in a cavity. An optical cavity is formed between two high reflectivity mirrors. When light is injected into the cavity it becomes trapped, traversing it many times giving a long overall absorption pathlength, L. A photodector located at the back of the second high reflectivity mirror measures the decay in the light leaking out of the cavity as a function of time. Light is injected into an empty cavity will decay exponentially with time (as illustrated in the graph below) and is described by:
![]()
where I0 and It are the light intensity before and after the cavity; 't' is the residence time of the light within the cavity and comes from the product of the speed of light, 'c', and the pathlength, 'L'; and 'τ' is the ring-down time (RDT) of the cavity i.e. the time it takes for the light to decay to 1/e of its initial intensity.
Upon injection of a small amount of laser light locked onto a broad absorption feature of a species of interest into a cavity containing a gaseous sample, absorption speeds up the decay of light within the cavity reducing the RDT. Assuming Beer-Lambert law behaviour, the decay of light within the cavity will still occur exponentially with time (see graph below) and is described by:
![]()
where 'α' is the molar absorption coefficient which is the product of the concentration of the absorbing species, [X], and the absorption cross-section of the species at the particular wavelength of the laser light, σX.
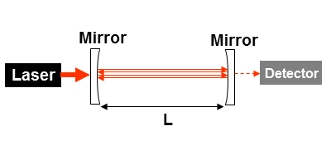 A simple schematic showing the set up of a cavity ring-down chamber with two high reflectivity mirrors, a laser providing the input beam and a detector measuring the small amount of light leaking out from the cavity.
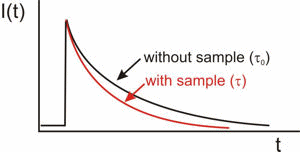 Graph illustrating the change in the ring-down time (RDT) in the presence and absence of an absorbing species.
You can find lots more detail about CRDS and its applications on the website of Prof. Andrew Orr-Ewing's from the University of Bristol.
CRDS in HIRAC
The initial setup and testing of a CRDS instrument for measuring NO3 has recently be carried out in HIRAC. An optical cavity was formed across the chamber diameter (140 cm) using two high reflectivity mirrors (Los Gatos Research, R = 99.995%, ROC = 1.0 m, λ = 590 - 650 nm) centred at λ = 620 nm. A small amount of laser light, locked onto a broad absorption feature of NO3 at λ = 623 nm, produced by a Nd:YAG (Litron Nano TRL) pumped dye laser (Lambda Physik FL3001) at pulse repetition frequency of 250 Hz was fibre coupled (OZ optics, QMMJ-55-UVVIS-200/240-3-15, 15 m) into the cavity and the light leaking out of the cavity was detected using a PMT (Hamamastu, H6780-20). These data were then analysed using a Gage oscilloscope card (Gage, CS14105) coupled to custom-written LabVIEW software.
NO3 radicals were generated in HIRAC using the reaction NO2 + O3 → NO3 + O2. Due to the presence of an interfering absorption signal from NO2 at 623 nm it is necessary to periodically take offline measurements to check for any detectable absorption from NO2. No detectable absorption by NO2 has been observed at the relatively low mixing ratios (~10s of ppb) employed in experiments to date. However, notable reductions in the RDT due to absorption by O3 have been observed, which although has a small absorption cross-section at 623 nm (~10-21 cm2molecule-1) is employed at relatively high mixing ratios (~500 ppb). Data taken during kinetic studies of NO3 reactions must therefore be carefully corrected for the changing contribution of O3 to the measured RDT.
With an average background RDT of 67.5 μs at atmospheric pressure and taking the average of 1000s RD events to give a time resolution of 4 s, the lowest detectable limit for NO3 radicals in the HIRAC chamber was found to be ~6.1 ppt. The HIRAC CRDS system was tested by directly measuring the rates of reaction of NO3 with a series of aldehydes and comparing the measured rate constants to literature values and all of the results were found to in excellent agreement with published data. The figures below give examples of data taken with the new CRDS system.
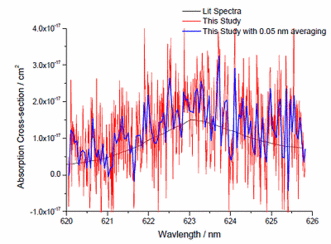 NO3 spectrum at atmospheric pressure recorded in HIRAC by CRDS at 0.01 nm resolution (red) and averaged to 0.05 nm resolution (blue). Also shown are data from Sander et al. (1986) (black) at 0.4 nm resolution.
![Decay of [NO3] through reaction with butanal](https://hirac.leeds.ac.uk/wp-content/uploads/sites/7/2017/11/c9cbd461c9.gif) Measured (black) and modelled (red) decay of [NO3] through reaction with butanal in HIRAC.
Measured (black) and modelled (red) decay of [NO3] through reaction with butanal in HIRAC.We now plan to use the HIRAC CRDS system to study reactions of NO3 with alkenes using thermal decomposition of N2O5 as a source of NO3to remove complications in analysis of kinetic traces caused by the reaction of alkenes with O3. Additionally we plan to intercompare with NO3 measurements inside HIRAC with those made by Laser Induced Fluorescence and broad-band CRDS. We also plan to apply CRDS to the measurements of other species in HIRAC and in particular glyoxal.